


Forecasting is a critical aspect of financial planning and analysis, enabling businesses to anticipate future trends based on historical data. Excel’s built-in forecasting tools make this process more accessible and efficient.
What is the Forecast Sheet Feature?
Excel’s Forecast Sheet is a tool designed to project future values based on existing historical data. It creates a forecast sheet with visual charts and detailed projections, making it easier to analyze future trends. This feature is especially useful for CFOs, business leaders, and financial analysts who need to make data-driven decisions.
How to Use the Forecast Sheet Feature
Prepare Your Data
To get started, ensure your data is organized with at least two columns: one for dates and one for values. For example, if you have a General Ledger with columns for “Period” and “Amount,” these will be your date and value columns.
Select Your Data Range
Navigate to the worksheet containing your data. Select the range of cells that you want to use for forecasting. This should include your date and value columns. For instance, if your data is in columns C (Dates) and D (Amounts), highlight these columns.
Create the Forecast Sheet
- Go to the Data tab on the ribbon.
- In the Forecast group, click on Forecast Sheet.
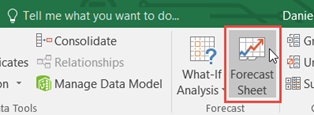
This action opens the Forecast Sheet dialogue box, where Excel will automatically generate a line chart based on your selected data range.
Customize Your Forecast
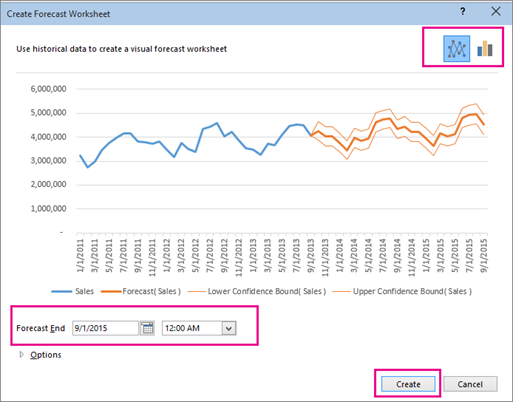
In the Forecast Sheet dialogue box:
- View the Chart: You’ll see a line chart displaying historical data and the forecasted trend. The chart includes the forecasted amounts along with lower and upper confidence levels.
- Adjust Forecast Settings: Click on Options to customize the forecast. Here, you can set the start and end dates for your forecast. For example, you might want to extend the forecast through the end of 2024.
- Set Confidence Level: By default, Excel provides a 95% confidence level, but you can adjust this based on your needs.
Generate the Forecast
After customizing your settings, click Create. Excel will generate a new worksheet with the forecast data and a detailed line chart. The new sheet will display:
- Forecast Amounts: Projected values based on your historical data.
- Lower and Upper Confidence Levels: Indicating the range within which future values are expected to fall.
- Forecast Formulas: Excel uses the FORECAST.ETS function behind the scenes to generate these projections. You can click on individual cells to view the formulas used.
The resulting forecast sheet provides a clear visual representation of future trends, with a line chart showing the historical data, forecasted amounts, and confidence intervals.
With just a few clicks, you can generate comprehensive forecasts that help in strategic planning and decision-making. Whether you’re forecasting sales, expenses, or other financial metrics, this tool is invaluable for CFOs, business leaders, and anyone involved in financial analysis.
Excel for CFOs & Business Leaders
Ready to run a data-driven business? Watch our free training to master financial tasks by taking advantage of advanced Excel techniques and new features.