Microsoft recently restructured its Copilot licensing to better fit how businesses are actually organized. The most meaningful change for small and midsize organizations is a new lower-cost plan and a promotional rate that runs through June 30, 2026. If you have been...
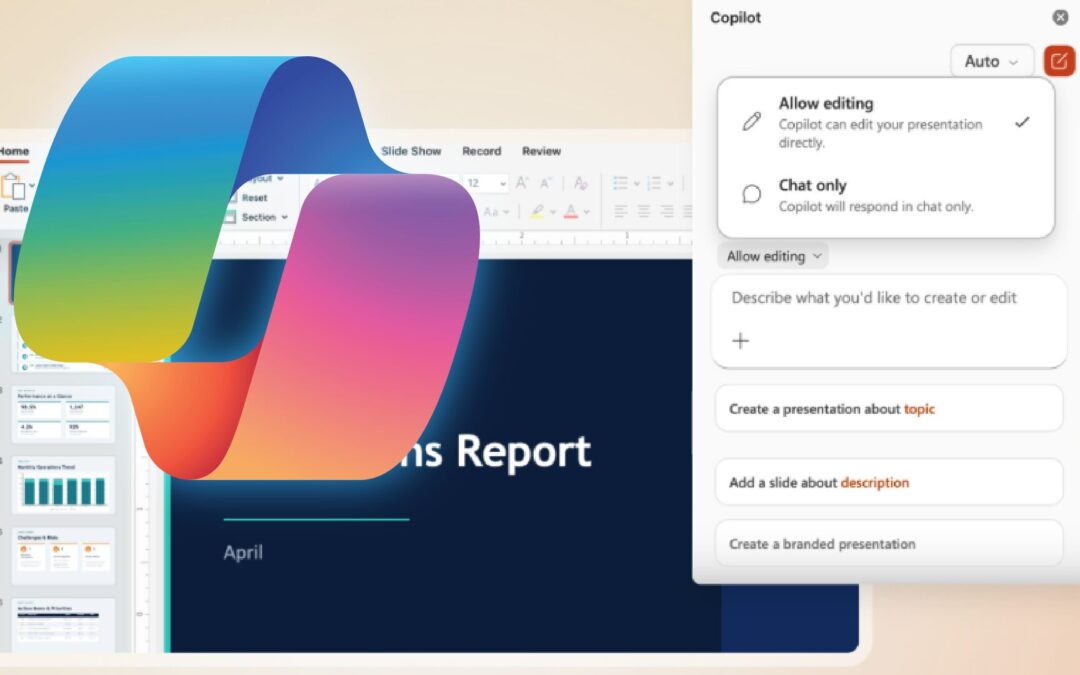
If you have Microsoft 365 Copilot and you opened Word, Excel, or PowerPoint recently, you may have noticed something different. The Copilot experience you were used to, the one that answered questions and offered suggestions you could choose to accept or ignore, has...
Microsoft continues to invest heavily in Microsoft Teams, pushing it far beyond chat and video calls and into the center of how work actually gets done. New AI-driven enhancements rolling out through 2026 are designed to make meetings more productive, collaboration...
Microsoft has confirmed an actively exploited zero-day vulnerability impacting Microsoft Office and Microsoft 365 applications. The vulnerability is being tracked and communicated through the Microsoft Security Response Center (MSRC), Microsoft’s official authority...
Microsoft is making Microsoft Teams safer by default, and most organizations will start seeing these changes in January 2026. Beginning January 12, 2026, Microsoft will automatically turn on new safety features in Teams for companies using standard settings. The goal...
Microsoft Ignite 2025 made one thing very clear: the future of work is no longer built only for large enterprises with massive IT teams. Microsoft’s latest announcements focused heavily on making AI, security, and modernization accessible, practical, and manageable...